

Freight Corridor Intelligence Market Statistics
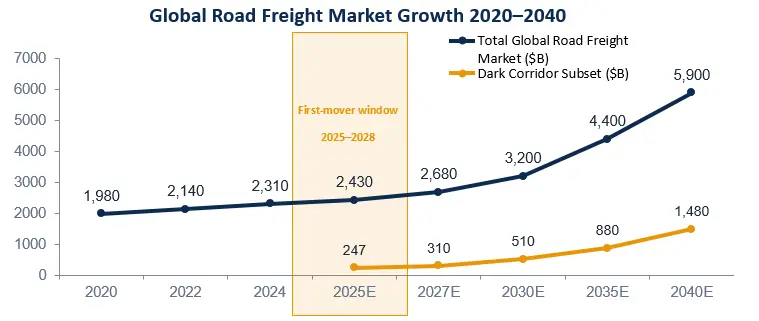
$4.25T Global Road Freight TAM 2024 | 25 Corridors Mapped End-to-End | $487B Uncaptured Opportunity | $340B+ Wasted in Empty Miles/Year | 8 Dark Corridors — First-Mover |
The Freight Corridor Intelligence Market is emerging as a strategic segment within the global logistics and transportation industry, focused on AI-powered freight analytics, corridor profitability assessment, route optimization, and real-time supply chain visibility. The market is gaining traction due to increasing cross-border trade, nearshoring activities, and growing investments in smart freight infrastructure across major global trade corridors. Advanced technologies such as AI, IoT, digital freight matching, and predictive logistics analytics are helping transportation operators reduce empty miles, improve operational efficiency, and enhance freight movement intelligence.
3 PROPRIETARY FRAMEWORKS
Framework 01 Corridor Profitability Index World's first margin-based ranking of 25 corridors. Not volume — entry opportunity. | Framework 02 The Dead Mile Map $342B destroyed annually, quantified per corridor. The most actionable insight in freight. | Framework 03 8 Dark Corridors First-mover opportunity maps — top-10 by 2030. Institutional capital positioned: zero. |
What This Freight Corridor Intelligence Market Report Is — And Why It Exists
"Every competitor tells you the market is $4.25 trillion. This report tells you which $487 billion of it has no dominant carrier, runs 15–19% operating margins, and has a first-mover window that closes in 2028. That is the difference between a market report and an intelligence report."
Global Freight Corridor Intelligence Market Report 2025–2032
The global freight and logistics industry is entering a once-in-a-generation realignment worth over $4.25 trillion, driven by nearshoring, AI-powered freight matching, geopolitical trade rerouting, and the emergence of high-growth cross-border logistics corridors. Yet, most freight market reports still stop at market size, CAGR, and competitive benchmarking — without revealing where the next wave of corridor profitability and logistics dominance will actually be created. This Global Freight Corridor Intelligence Market Report 2025–2032 uncovers more than $487 billion in untapped freight opportunities, identifies $342 billion lost annually through empty miles and inefficient routing, and maps 25 strategic freight corridors expected to reshape global trade flows through 2032. From the Vietnam–China manufacturing corridor and US–Mexico nearshoring routes to the India–UAE IMEC corridor and East Africa’s rapidly expanding trade networks, the report delivers deep corridor profitability analysis, dead-mile intelligence, AI-driven logistics transformation insights, freight technology adoption trends, and first-mover investment opportunities for 3PLs, freight operators, infrastructure investors, and global supply chain leaders seeking to secure long-term competitive advantage in the future of freight transportation.
Market size ($4.25T in 2025, growing at 5% CAGR). Regional breakdown (Asia-Pacific 40%, North America 28%, Europe 22%). Top-10 companies by revenue. Technology trends. Drivers and restraints. You can read any one of them and know everything the others will say before you open them.
What Every General Market Intelligence Report Says | What MMRS report delivers |
"The global road freight market is $4.25 trillion." | "$487 billion of that market has no dominant carrier — here are the corridors, the margins, and the entry window." |
"Asia-Pacific is the fastest-growing region at 8.2% CAGR." | "Vietnam–China border: 19% freight CAGR, 16.8% carrier margin, zero Tier-1 presence. Enter before 2028." |
"Key players include DHL, Kuehne+Nagel, DSV." | "DSV bought DB Schenker for $15.8B in April 2025. They are looking inward until 2028. That is your window." |
"EV trucks and autonomous driving are key trends." | "Autonomous trucking improves margins 8–15% on I-10 and Rhine by 2033. On dark corridors, any technology gives you sole-source shipper relationships today." |
"Empty miles are an industry challenge." | "$342 billion destroyed per year. Here is which corridor bleeds the most, and the AI tool that eliminates it in 6 months." |
Freight Corridor Intelligence Market Report 2025 — Key Highlights:
World's first corridor-level intelligence report — 25 global freight corridors ranked by net margin potential (CPI Score), not just market size. Covers all 6 regions: North America, Europe, Asia-Pacific, Middle East, Africa, Latin America.
$487 billion uncaptured opportunity — 73% of road freight revenue is contested on just 6 saturated corridors at 4.1% margins. The remaining 27% runs 11–19% margins with zero dominant carrier. This report maps exactly where.
The Dead Mile Map — $342 billion destroyed annually by empty trucks. First-ever corridor-level quantification showing which lanes bleed the most — and how AI dispatch eliminates it in under 6 months with $9M+ gain for a 500-truck fleet.
8 Dark Corridors identified — Vietnam–China Border (16.8% margin, 19% CAGR), India–UAE IMEC, Morocco–Spain, East Africa, Central Asia BRI and 3 more — all growing 16–45% annually with near-zero institutional carrier presence today.
First-mover window closes 2028 — DSV, DHL, Maersk are integrating major acquisitions and looking inward. This is the exact window to enter dark corridors before the world's top 4 logistics giants turn their capital toward them.
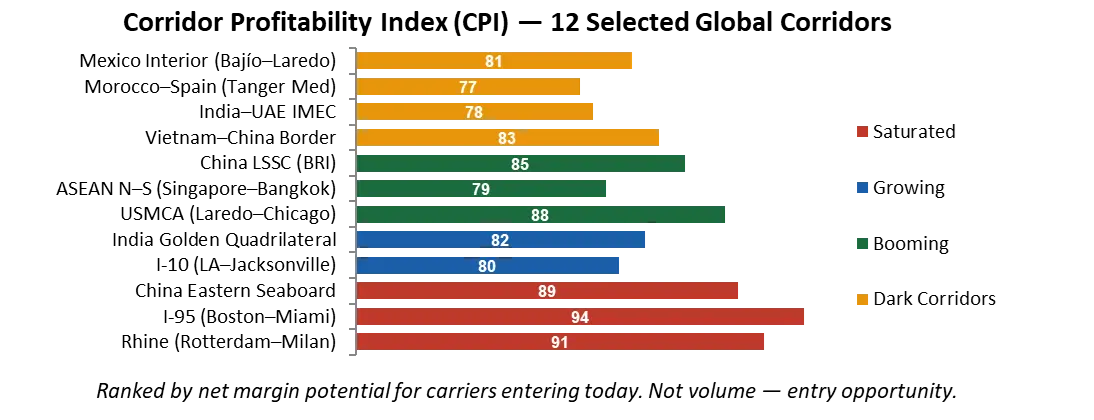
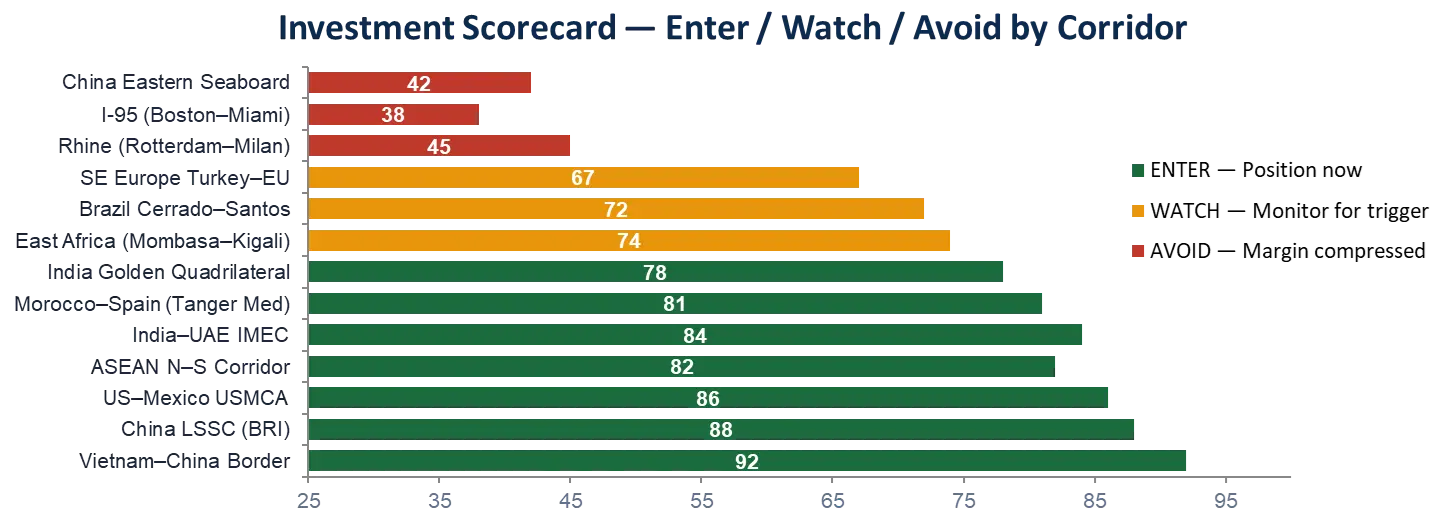
Investment Scorecard: Enter / Watch / Avoid — every corridor gets a final conviction verdict backed by CPI score, geopolitical risk rating, technology readiness, and competitive density — so a logistics CEO walks away with a clear decision, not just data.
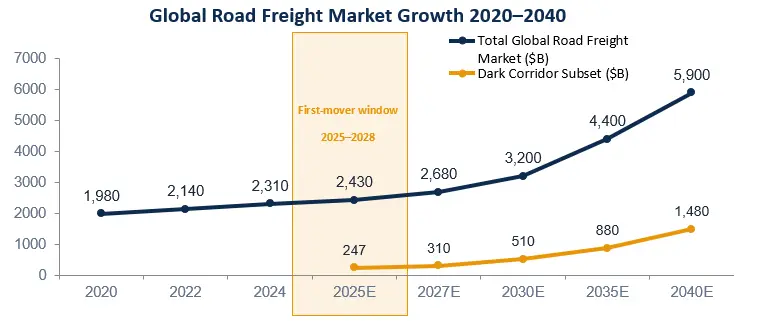
Global Freight Corridor Intelligence Market _ 25 Corridors: Corridor Profitability Index
The Corridor Profitability Index is the first systematic ranking of global freight corridors by net margin potential for carriers entering or expanding today — not by volume, not by CAGR.
It synthesises five dimensions: freight volume and growth trajectory, rate and margin environment, competitive density, infrastructure investment pipeline, and geopolitical stability. The result is a single number — 0 to 100 — that tells a carrier executive exactly where to put capital. A high CPI does not mean a big corridor. It means a smart entry today.
The Rhine corridor in Europe scores 91 — the world's most efficiently run freight lane, 61% digitally penetrated, sub-14% empty miles. It also delivers 4.2% operating margins. The US–Mexico USMCA interior corridor scores 88 — $295 billion in freight, 11.2% margins, and $170 billion of new manufacturing commitments from GM, BMW, and Samsung driving volume 31% higher annually. The Vietnam–China border scores 83, with nascent infrastructure and 6% digital penetration — and delivers 16.8% margins for carriers already operating there. The CPI makes this trade-off visible in one number. The chart ranks 12 selected corridors across all six global regions.
Global Freight Corridor Intelligence Market_ The Dead Mile Map: $340 Billion Destroyed Annually
One in every four truck miles globally carries no freight. That is not a rounding error in a market model. It is $342 billion in annual value destruction — and it has a name, a map, and a fix.
ATRI research confirmed deadhead miles at 20.6% of all US carrier miles — 26% for private fleets. Real-world industry estimates place the global figure between 20% and 35% once underreporting is corrected. A single truck running 100,000 miles per year at 20% empty rate burns $37,000 in cost with zero revenue. Across 340 million commercial trucks globally, the annual destruction exceeds $300 billion. Our corridor-adjusted estimate: $342 billion.
The scatter chart below maps every major corridor on two axes — digital freight matching penetration and empty-mile rate. The pattern is consistent and unambiguous across every region: every 10 percentage point increase in digital penetration reduces empty miles by 4–6 points. The corridors with the worst empty-mile rates — Brazil Cerrado at 38%, East Africa at 35%, India Golden Quadrilateral at 31% — are the same corridors with the highest operating margins. Solving the dead mile problem on these corridors does not just reduce cost. It creates a service standard that global MNC shippers will pay a 40–60% rate premium to access.
The Arithmetic That Changes Every Board Conversation 500 trucks. Cut deadhead from 25% to 18% using AI dispatch — available today, payback in 6 months. Annual operating contribution gain: $9.25 million. Zero new trucks. Zero new drivers. Zero new revenue. Just the elimination of waste that was always there, now made visible. |
Global Freight Corridor Intelligence Market_ The 8 Dark Corridors: What No Other Report Has Mapped
Eight freight corridors will rank in the global top-10 by 2030. Combined, they represent over $350 billion in annual freight value growing at 16–45% per year. Institutional logistics capital positioned on them today: essentially zero.
Each dark corridor shares four signals — freight growing faster than 15% annually, carrier concentration below 10% for any single player, infrastructure investment running ahead of carrier supply, and digital matching penetration below 20%. These are first-mover conditions. They have historically generated 15–22% operating margins for 3–5 years before the market catches up. The table below maps all eight. Every row is a strategic decision, not a market observation.
Corridor | Region | CAGR | Margin | Why It Matters — The One Reason to Act Now |
Vietnam–China Border | Asia | 19% | 16.8% | Samsung, Intel, Foxconn fabs relocated. No Tier-1 carrier. Rate premium 2.4× local operators. Entry window: now. |
Mexico Bajío–Laredo | N. America | 31% | 15.1% | $170B US manufacturing committed. GM, BMW, LG, Samsung campuses. Digital penetration under 20%. |
India–UAE IMEC Land | Middle East | 45% | 17.6% | G20-endorsed corridor. Phase 1 traffic beginning 2025–2026. Bonded warehouse plays at Mundra + Dubai LC. |
Morocco–Spain Tanger Med | Europe/Africa | 28% | 18.3% | Renault, Airbus, Stellantis fabs. EU nearshoring thesis. Africa's largest port as origin. CEVA piloted July 2025. |
East Africa Mombasa–Kigali | Africa | 22% | 19.4% | 38% empty rate — Africa's worst backhaul. $24T DRC mineral corridor. Agricultural return freight unmanaged. |
Central Asia BRI Road | Central Asia | 35% | 16.2% | 200% YoY truck growth post-Russia sanctions. Capacity shortage severe. 450% cargo value growth in 2025. |
Brazil Cerrado–Santos | Latin America | 16% | 13.8% | 180 million tonnes agri freight. 38% empty rate. Digital load boards absent. World's most productive agri frontier. |
SE Europe Turkey–EU | Europe | 18% | 11.9% | Turkey's $1T manufacturing economy. Left to small operators due to regulatory friction. EU convergence = catalyst. |
The First-Mover Window — 2025 to 2028 DSV completed the $15.8B acquisition of DB Schenker in April 2025. DHL, Maersk Logistics, and Kuehne+Nagel are all integrating major deals. The world's four largest logistics companies are looking inward until at least 2028. Every dark corridor in this table is structurally open. After 2028, first-mover positions will be filled. |
Global Freight Corridor Intelligence Market _ Global Coverage: Six Regions, One Intelligence Framework
This report applies the same corridor intelligence framework — CPI scoring, dead mile mapping, freight arbitrage analysis, geopolitical risk scoring — to every major region on earth. No region is treated as an afterthought.
Region | Market 2025E | Defining Corridor | The One Insight |
North America | $820B | US–Mexico USMCA (Laredo–Chicago): $295B, 11.2% margin, 31% CAGR | Nearshoring is not a trend. It is done. $170B committed. Capacity is the bottleneck. |
Europe | $640B | Rhine (Rotterdam–Basel–Milan): $420B, 4.2% margin, 61% digital | Most efficient corridor in the world. Also the most compressed. Enter Turkey–EU instead. |
Asia-Pacific | $980B | Vietnam–China Border + ASEAN N–S: $192B combined, 14–17% margin | Manufacturing is moving. Freight capacity is not following. Largest gap globally. |
Middle East | $210B | India–UAE IMEC Land Component: $28B, 45% CAGR, 17.6% margin | G20-backed corridor. Phase 1 commercial traffic now. Zero Tier-1 carrier present. |
Africa | $145B | East Africa Mombasa–Kigali–DRC: $32B, 35% empty rate | 38% deadhead = Africa's biggest inefficiency. Agricultural backhaul is the unlock. |
Latin America | $180B | Brazil Cerrado Agri Belt (Mato Grosso–Santos): $45B, 13.8% margin | 180M tonnes of agri freight. Digital load boards essentially absent. CargoX is the only player. |
Global Freight Corridor Intelligence Market Three Technology Waves — One Strategic Sequence
Autonomous trucking, electric vehicles, and AI-powered freight matching are not three separate technology stories. They are three phases of the same margin war — and the sequence matters more than the technology itself.
Start with AI-powered freight matching — the wave that pays back in months. Uber Freight's algorithmic bundling reduces deadhead by 22.6% on matched lanes. A major brewery eliminated 900,000 empty miles in a year through backhaul booking 24–72 hours before delivery. At $1.85 per mile average operating cost, every 1% reduction in deadhead on a 500-truck fleet is $1.3 million in annual saving. This ROI is available today, at any fleet scale, on any corridor globally. It funds the capital for everything that follows.
Electric trucking is operational now. DHL's eActros 300 electric tractor went live in April 2024. CEVA's HVO Duo Trailer launched July 2025 on the Barcelona–Madrid corridor — projected to cut 520 tonnes of CO₂ annually and remove the equivalent of 440 trucks from the road. Fuel cost drops 40–60% per kilometre at scale. The Rhine, I-95, and China Eastern Seaboard will be predominantly electric by 2032. On dark corridors, the first carrier to arrive with EV infrastructure locks in every ESG-mandated shipper before competitors figure out where the corridor is.
Autonomous long-haul becomes commercially viable on the I-10 and select EU Autobahn corridors between 2028 and 2033. Aurora Innovation and Kodiak Robotics are in pre-commercial operations with Werner Enterprises, FedEx, and Uber Freight. Eliminate the driver — 25–35% of operating expense — enable 24/7 utilisation, and long-haul net margins improve by 8–15 percentage points. The carriers building AI dispatch infrastructure today are building the data layer that autonomous systems will operate on tomorrow. That sequence is not optional.
Global Freight Corridor Intelligence Market Geopolitical Freight Chessboard
The Red Sea disruption rerouted $400 billion of ocean freight in 90 days and drove a 350% surge in Asia–Europe container rates. The next disruption arrives by land — and the corridors that benefit are already identifiable.
Russia sanctions rerouted the Northern Corridor. The Central Asian BRI Middle Corridor — Urumqi to Istanbul via Kazakhstan and Iran — recorded 200% growth in truck movements and 450% growth in cargo value year-on-year through 2025. A single geopolitical event created an entirely new freight corridor from near-zero to critical infrastructure in under 18 months. Every corridor in this report is scored on five geopolitical risk dimensions: tariff exposure, border policy stability, conflict proximity, sanctions sensitivity, and regulatory friction. The Rhine scores 91/100. The Central Asia BRI scores 38/100 — highest risk, fastest growing, simultaneously. Risk and opportunity share the same address.
The Taiwan Strait scenario is the one strategic planners must model. A disruption in Strait shipping would immediately overflow ASEAN North–South road capacity, surge demand on Vietnam–China border lanes to levels current carrier networks cannot absorb, and create pricing power for any positioned carrier equivalent to US West Coast port operators during the COVID container surge of 2021. The carriers who read the geopolitical map before the event capture the rates. The ones who arrive after the disruption find every lane already locked up.
Global Freight Corridor Intelligence Market Investment Scorecard: Enter, Watch or Avoid
Every corridor receives a final conviction score — a synthesis of CPI, geopolitical risk, technology trajectory, and competitive density — mapped to one verdict: Enter now, Watch for a trigger, or Avoid.
The seven Enter corridors — led by Vietnam–China Border (92), China New Land-Sea Corridor (88), and US–Mexico USMCA interior (86) — combine the three conditions that have historically generated durable first-mover positions: fast volume growth, low competitive density, and infrastructure improving faster than carrier supply. The three Avoid corridors — Rhine, I-95, China Eastern Seaboard — are not bad businesses. They are saturated ones. Brilliant to operate on if you are already there. Extremely poor entry choices in 2025 without a structural differentiator that competitors cannot replicate.
Global Freight Corridor Intelligence Market Strategic Narrative
The global freight industry is undergoing four simultaneous structural shifts — and the companies that understand all four, together, will own the next decade of logistics economics.
Manufacturing geography is being permanently redrawn. $170 billion of US-linked production has committed to Mexico. Vietnam's electronics and semiconductor output grows at 19% annually. Morocco is the EU's new manufacturing base. India has committed $26 billion in Production-Linked Incentive schemes to become the world's next export manufacturing hub. Every single one of these relocations creates a freight corridor that barely existed five years ago. The logistics companies who have mapped this geography in advance of the volume will own the lane. Those who wait for the volume to be obvious will arrive after first-mover contracts have been signed for 5 years.
The digital freight layer is crossing the threshold from experimental to structural. Digital matching penetration is 61% in Europe's best corridors, 32% in US domestic, and below 10% in every dark corridor in this report. This gap between the most and least digitised freight routes on earth is simultaneously the largest inefficiency pool ($342 billion in dead miles annually) and the largest investment opportunity in global logistics. The freight tech companies building platforms on underserved corridors — Lori Systems in East Africa, CargoX in Brazil, GoComet in India, Sennder in Europe — are not software businesses. They are land-grabs in the geography of global commerce, and every major 3PL will need to acquire or replicate them within five years.
Geopolitical trade rerouting has made corridor intelligence permanently mandatory. The Red Sea proved that a single chokepoint disruption can rewrite $400 billion of freight flows in weeks. The Taiwan Strait, the Strait of Hormuz, Russia-Europe — the structural risk vectors to ocean shipping grow every year, not fewer. Road freight is the alternative. The corridors that serve as land-bridges — Central Asia BRI, ASEAN North–South, India–UAE IMEC — score highest on both geopolitical resilience and margin opportunity. They are not contingency plans. They are the primary thesis for freight capital allocation through 2030.
MMRS ANALYST Word "The freight corridor code is not complicated once you know how to read it. High volume growth. Low competition. Improving infrastructure. First-mover contracts available. That code is active on eight corridors right now. This report named them, scored them, and mapped the window. The only question left is whether you will be positioned when it closes." |